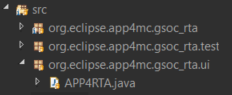
User Interface (APP4RTA)
Search Amalthea
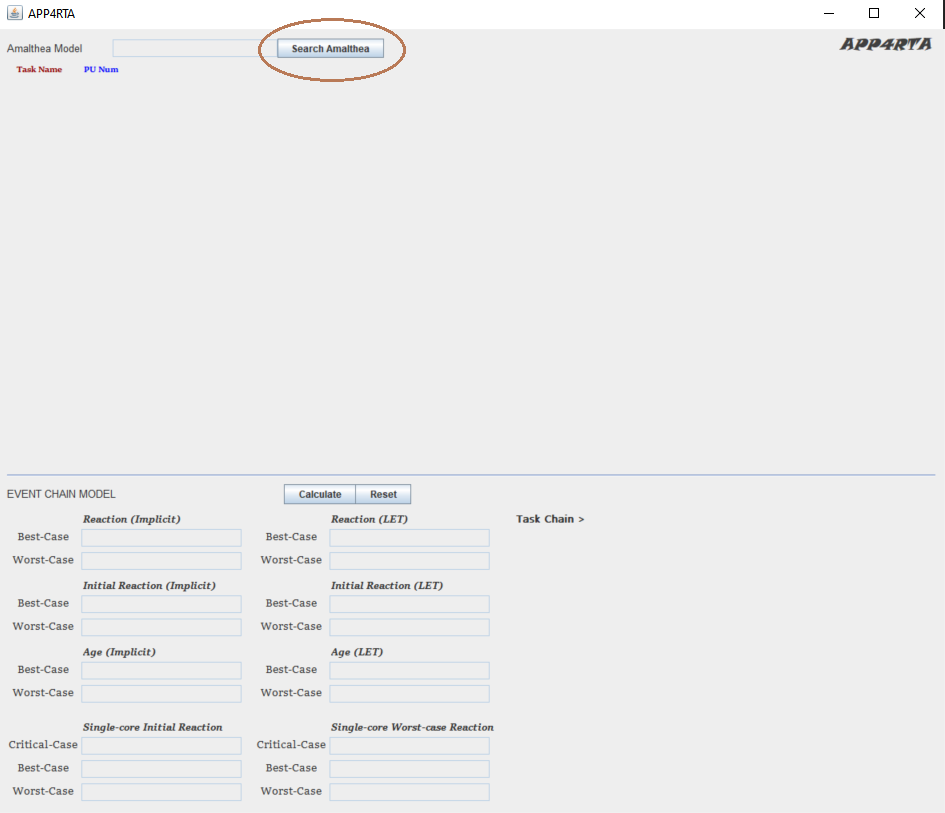
Based on the horizontal line on the middle, the upper part is for response time and mapping analysis and the lower part is for end-to-end event chain latency analysis. The first thing to do is deciding a target Amalthea model. Click the Search Amalthea button.
Navigate to The Amalthea Folder
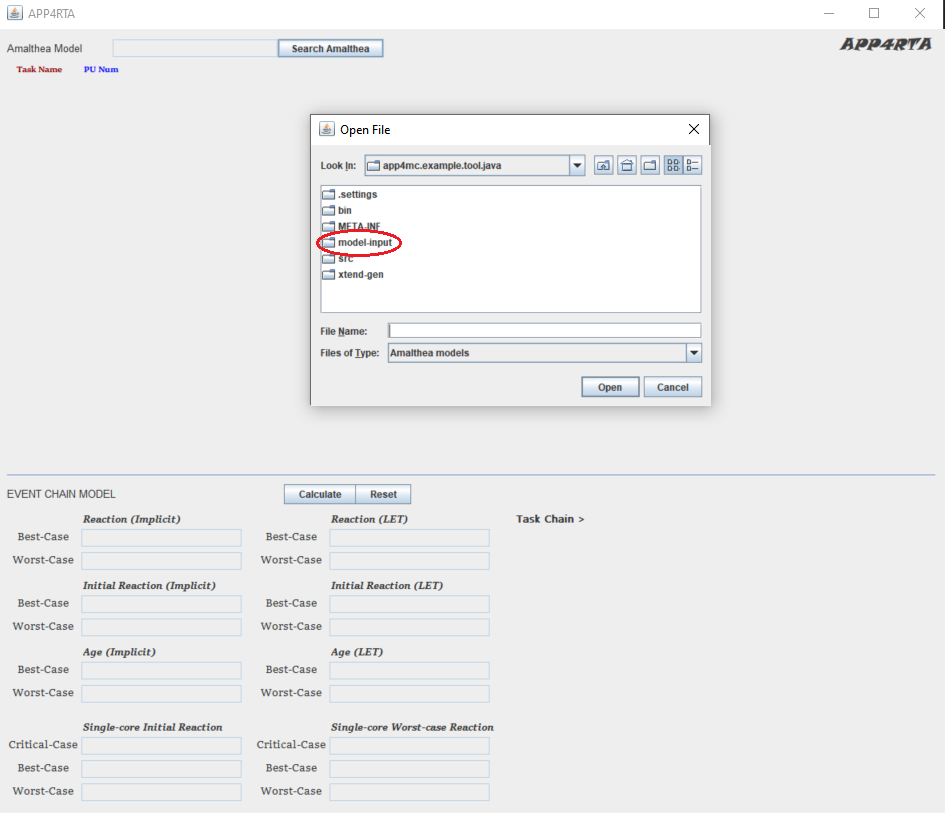
Navigate to the folder where the target Amalthea model file is located.
Select & Open Amalthea
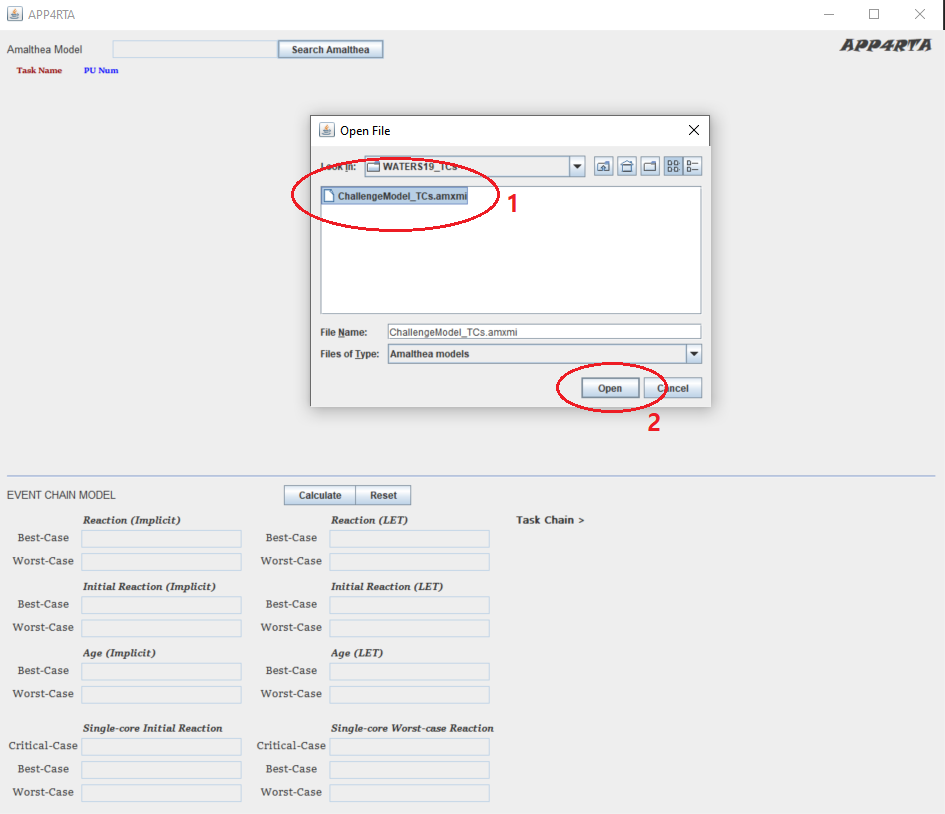
Select and open an Amalthea file. In this example, a multi-core Amalthea model is chosen.
Amalthea Model Loaded
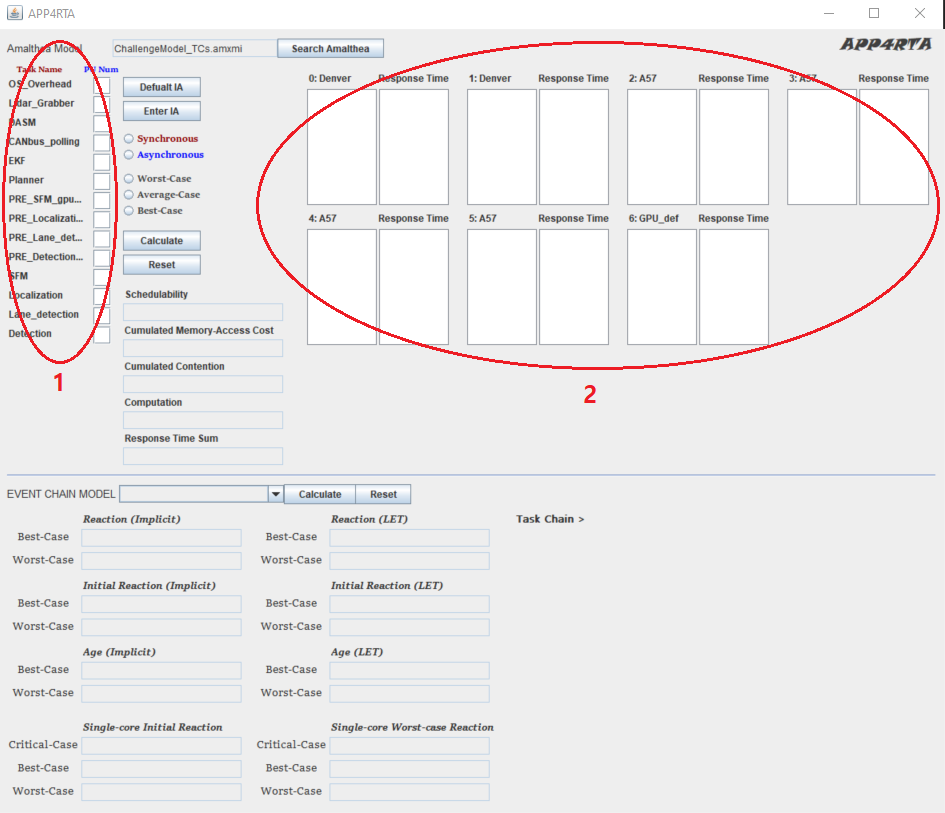
After a model is loaded, it shows all the tasks (1) and processing units (2) that the selected model has.
Integer Mapping
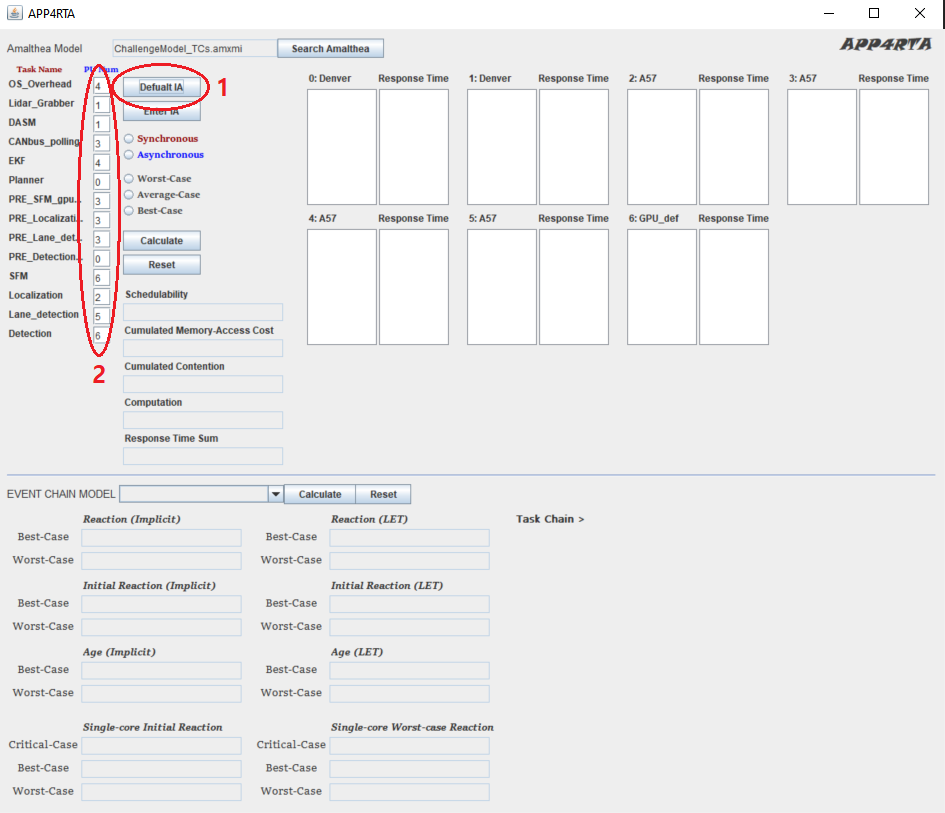
When the Default IA (1) button is clicked, each task’s box (2) is automatically filled with an integer number. This indicates that a task is about to be mapped to the corresponding identity number of processing unit. One can also write an integer number in each box manually. The Default IA means an integer array to map all the tasks to processing units and that is specifically designed to make the ChallengeModel_TCs.amxmi model schedulable. Therefore it is always possible that it does not serve for other multi-core models. However, the Default IA would only contain numbers of 0 when a single-core model is loaded.
Assign Tasks to Processing Units
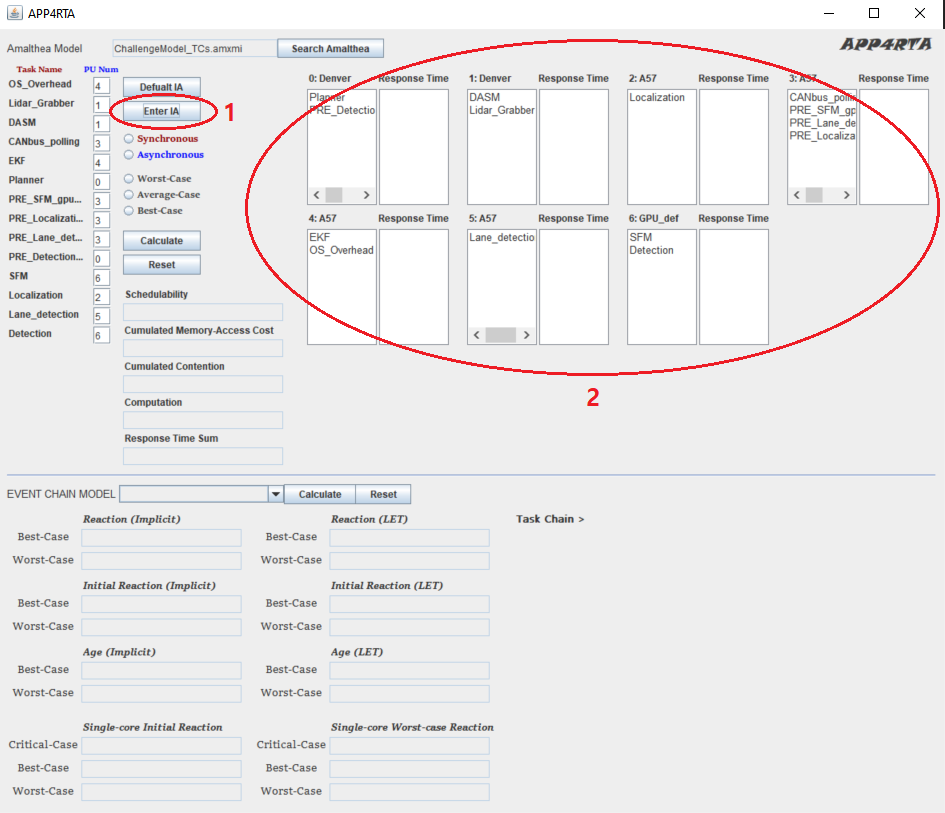
When the Enter IA (1) button is clicked, each task is mapped to the corresponding processing unit (2). Since there are 7 processing units in the ChallengeModel_TCs.amxmi model, it shows 7 pairs of lists. The list on the left side of each pair is for listing names of the tasks that are mapped to the corresponding processing unit while one on the right side is for listing response times of the corresponding tasks.
Measure Response Time
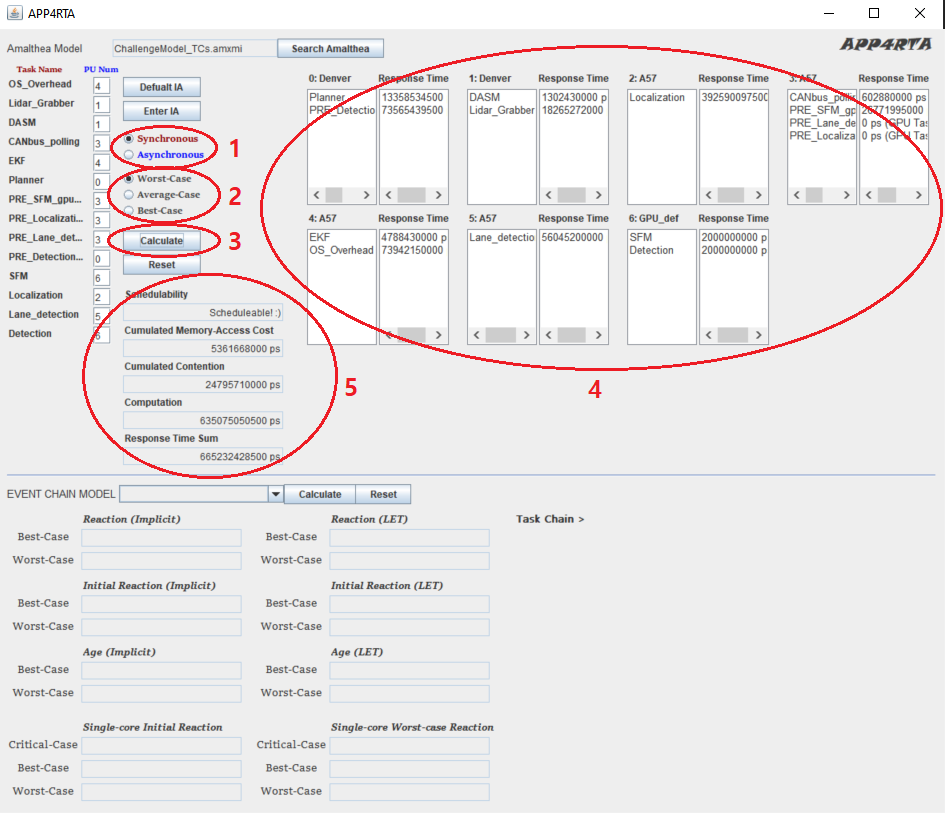
- Choose the offloading mode between
Synchronouscase andAsynchronouscase. (2) Choose the execution case betweenWorst-,Average-, andBest-Case. (3) By clicking theCalculatebutton, each task’s response time is calculated and printed on the right list of each list pair (4). All analysis results appear in (5) which include:Schedulability,Cumulated Memory-Access Cost,Cumulated Contention,Computation, andResponse Time Sum.
Task Chain Analysis
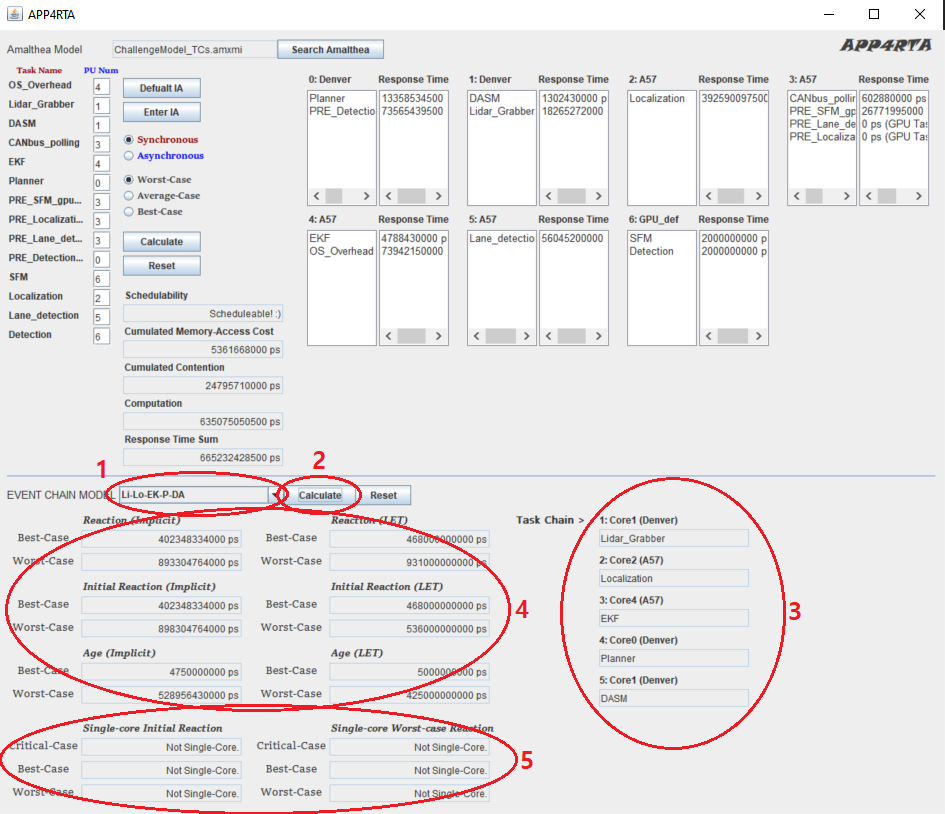
Now that every task’s response time is measured, it is possible to measure end-to-end task chain latency with the derived task response times. (1) To analyze end-to-end task chain latency, a task chain in the combo-box should be selected first. (2) Click the Calculate button, then the selected task chain would be illustrated (3) and all measurement results would also be printed out (4)(5). Since the observed Amalthea model is a multi-core model here, the single-core analysis results are not available (5).
Change The Model
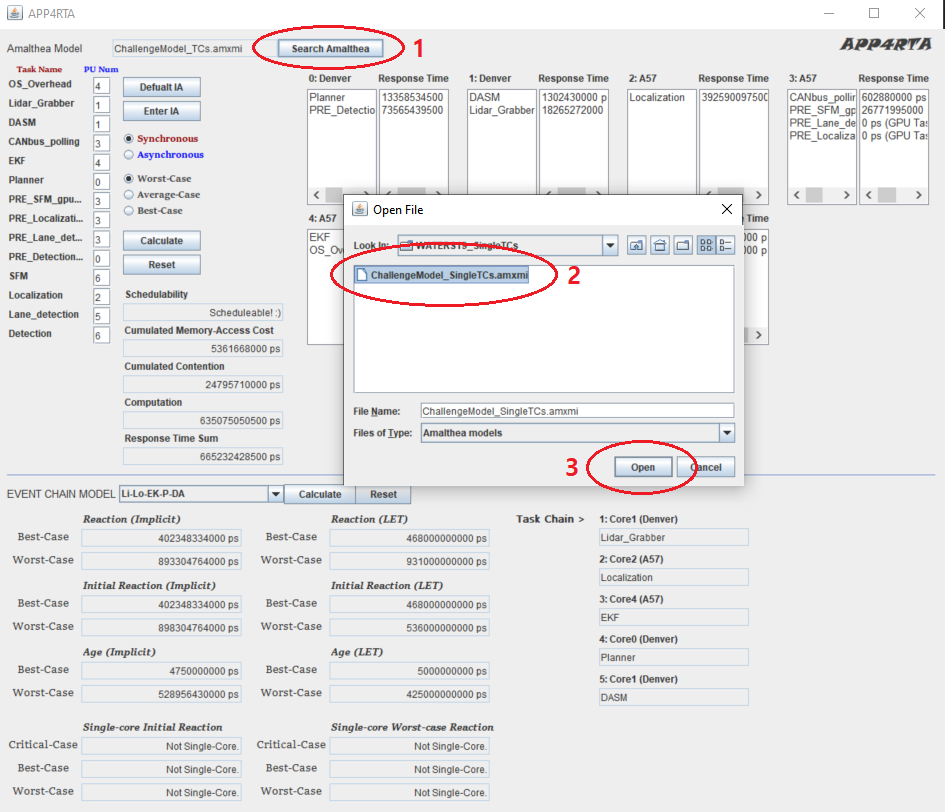
It is possible to change the observed model without clicking the Reset buttons. Apply the same process but this time with the ChallengeModel_SingleTCs.amxmi file that is a single-core Amalthea model (1) (2) (3).
Single-core RTA
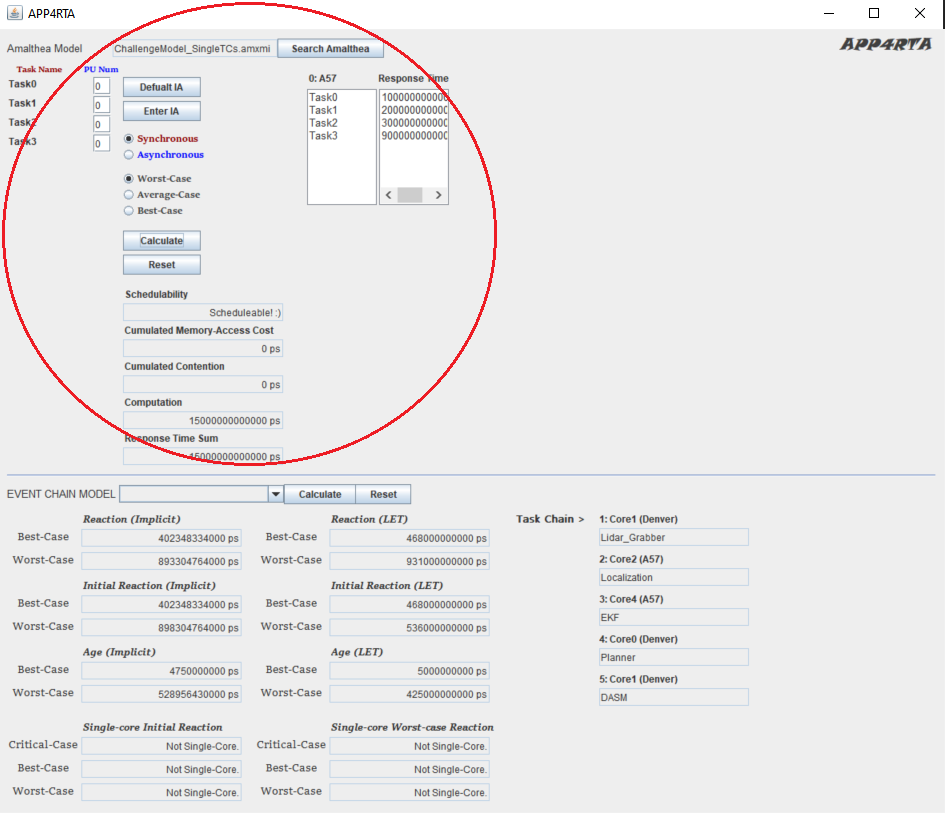
The ChallengeModel_SingleTCs.amxmi model only has one processing unit with four tasks. As it is already mentioned, the Default IA only contains numbers of 0 because a single-core model is loaded this time. The process is the same.
Single-core Task Chain Analysis
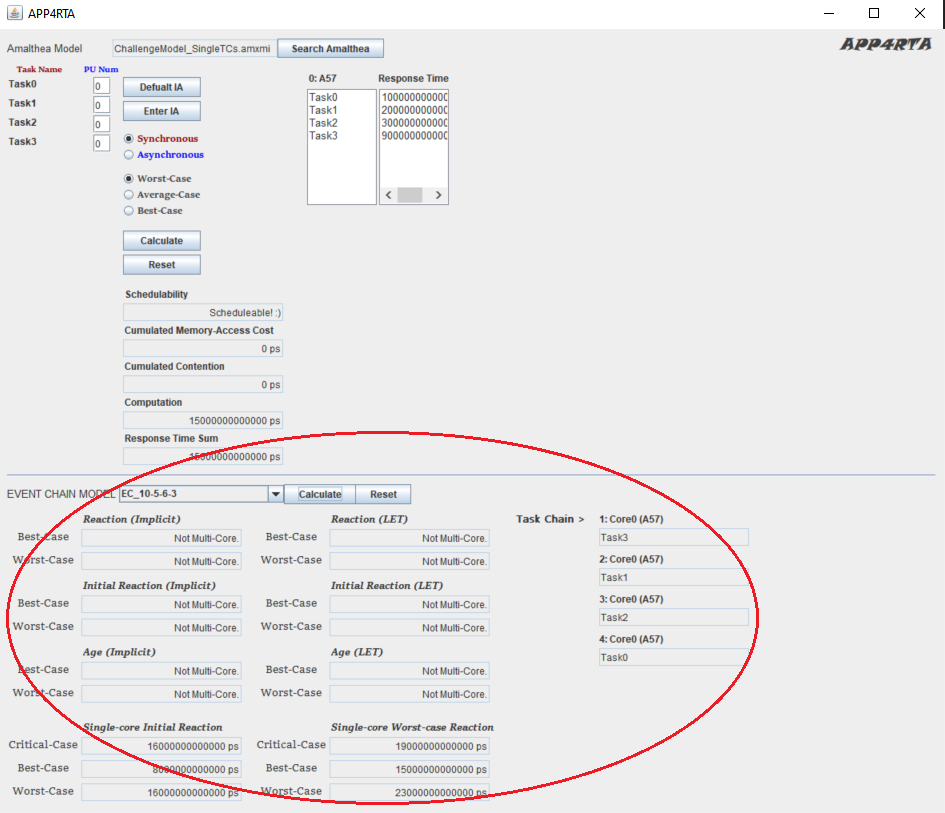
Now that every task’s response time is measured, it is possible to measure end-to-end task chain latency with the derived task response times. The process is the same. However, a single-core model is analyzed this time. Therefore, latency results regarding single-core are only available while multi-core results are not in this case.
Download PDF file to see offline.